


Quantitative Aptitude Set -124
Feb 03 2024
Here we are providing new series of Quantitative Aptitude Questions for upcoming exams, so the aspirants can practice it on a daily basis.
Study the following information carefully and answer the questions given below:
The following line graph represents the number of students in different Engineering colleges
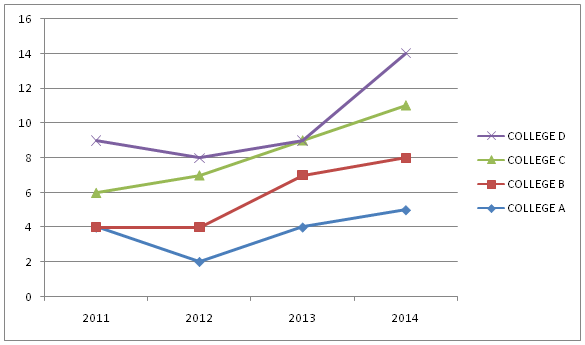
1) What is the sum of the total number of students in the college A, B, C and D in the year 2014?
A.3445000
B.3550000
C.3700000
D.3800000
E.3654000
2) What is the difference between the sum of the no. of students in college C and D in the year 2013 and the sum of the no. of students in college A and B in the year 2012?
A.1420000
B.1450000
C.1200000
D.1242500
E.1440200
3) What will be the ratio of the total no. of students of college A and C in 2013 to the total no. of students of college B and D in the same year?
A.13: 16
B.26: 8
C.28: 7
D.27: 7
E.26: 9
4) Find the average of the total no. of student of all the college in the year 2013.
A.700000
B.882000
C.120000
D.725000
E.187600
5) What is the approximate percentage of the total no. of students in college B in 2012 out of the total no. of students in all the colleges in 2012?
A.16%
B.11%
C.19%
D.24%
E.22%
Answers :
1) Answer: D
Total students (A + B + C + D) in 2014 = (5 + 8 + 11 + 14) X 100000
= 3800000
2) Answer: C
No. of students (A + B) in 2012 = 400000 + 200000 = 600000
No. of students (C + D) in 2013 = 1800000
Difference = 1800000 – 600000 = 1200000
3) Answer: A
Required ratio = (4 + 9): (7 + 9) = 13: 16
4) Answer: D
Total students of (A + B + C + D) in 2013 = 2900000
Average = 2900000/4 = 725000
5) Answer: C
Approximate % = 400000/(200000 + 400000 + 700000 + 800000) x 100
= 19.04 = 19% approx.