


Quantitative Aptitude Set -509
Feb 22 2025
Here we are providing new series of Quantitative Aptitude Questions for upcoming exams, so the aspirants can practice it on a daily basis.
Study the following information carefully and answer the questions given below.
The given pie chart shows the number
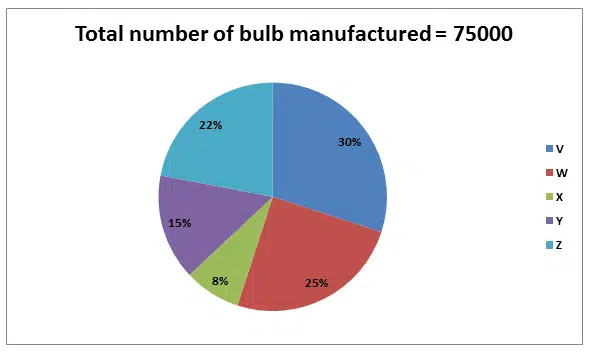
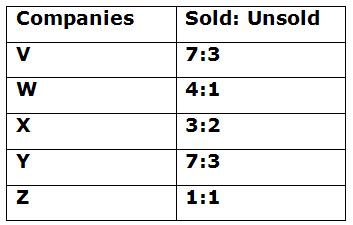
The given table shows the ratio of the number of bulbs sold to unsold in five different companies.
1) The number of unsold bulbs in X is what percent of the number of sold bulbs in V?
A.15.23%
B.17.65%
C.13.56%
D.20.93%
E.12.12%
2) What is the average number of unsold bulbs in all the companies together?
A.4900
B.4905
C.4910
D.4915
E.4920
3) The number of bulbs sold in F is 20% more than the number of bulbs sold in Z and the number of unsold bulbs in F is 30% more than the number of bulbs sold in W. Find the total number of bulbs manufactured in F?
A.28900
B.29400
C.29600
D.29500
E.28800
4) What is the ratio of the number of bulbs sold in Y and X together to the total number of bulbs manufactured in all the companies together?
A.143:1000
B.147:1000
C.141:1000
D.149:1000
E.153:1000
5) What is the difference between the total number of bulbs manufactured in Z and X together and W and V together?
A.18250
B.18550
C.18750
D.18450
E.18520
Explanation :
1) Answer: A
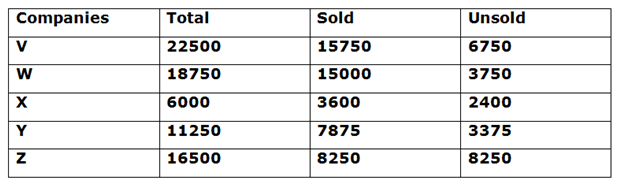
Required percentage = 2400/15750 * 100 = 15.23%
2) Answer: B
Required average = (6750 + 3750 + 2400 + 3375 + 8250)/5= 4905
3) Answer: B
Required total = 120/100 * 8250 + 130/100 * 15000= 29400
4) Answer: E
Required percentage = (7875 + 3600):75000
= 153:1000
5) Answer: C
Required difference = ((30 + 25) – (22 + 8))/100 * 75000 = 18750