


Quantitative Aptitude Set -560
Apr 14 2025
Here we are providing new series of Quantitative Aptitude Questions for upcoming exams, so the aspirants can practice it on a daily basis.
Study the following information carefully and answer the questions given below.
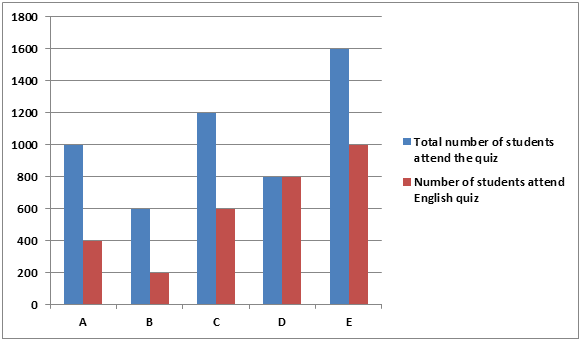
The given bar graph shows the total
Total number of students who attended the quiz = number of students who attended English quiz + number of students who attended Science quiz.
1) What is the average number of students who attended science quiz from A, C and E together?
A.400
B.500
C.600
D.700
E.800
2) The total number of students who attended English quiz from B is what percent of the number of students who attended English quiz from E?
A.20%
B.30%
C.40%
D.50%
E.None of these
3) Find the number of students who attended science quiz from D?
A.100
B.400
C.200
D.300
E.None of these
4) What is the average number of students who attended science quiz from all the schools together?
A.420
B.440
C.450
D.480
E.460
5) What is the ratio of the number of students who attended English quiz from A to D?
A.3:2
B.3:5
C.2:3
D.1:2
E.2:1
Explanation :
Number of students attended science quiz from A = 1000 – 400 = 600
Number of students attended science quiz from B = 600 – 200 = 400
Number of students attended science quiz from C = 1200 – 600 = 600
Number of students attended science quiz from D = 800 – 800 = 0
Number of students attended science quiz from E = 1600 – 1000 = 600
1) Answer: C
Required average = (600 + 600 + 600)/3 = 1800/3 =600
2) Answer: A
Required percentage = (200/1000) * 100 = 20%
3) Answer: E
No one attended the science quiz from D. So, 0
4) Answer: B
Required average = (600 + 400 + 600 + 0 + 600)/5
= 2200/5
= 440
5) Answer: D
Required ratio = 400:800
= 1:2